Tsunami-Resistant Tower CFD
Modeled transient tsunami flow around monopole and lattice tower geometries using multiphase CFD, comparing free-surface behavior, velocity fields, and hydrodynamic loading.
Matched multiphase simulations compare free-surface response around solid and open-frame tower geometries.
Two tower geometries. One flow condition.
Both 20 m towers were simulated under the same transient multiphase conditions: 8 m/s inlet velocity, 5 m initial water depth, and k-omega SST turbulence modeling.
Comparing free-surface and wake development.
Both cases use the same phase-fraction and velocity color scales so differences between geometries remain visually comparable.
Resolving the open frame efficiently.
The lattice introduces hundreds of curved faces, brace intersections, and narrow flow passages. Early automatic meshes exceeded 10 million cells, so curvature and refinement settings were simplified while preserving the open geometry. The final lattice mesh contained approximately 2.2 million cells and 510k nodes.
Hydrodynamic loading is similar in magnitude.
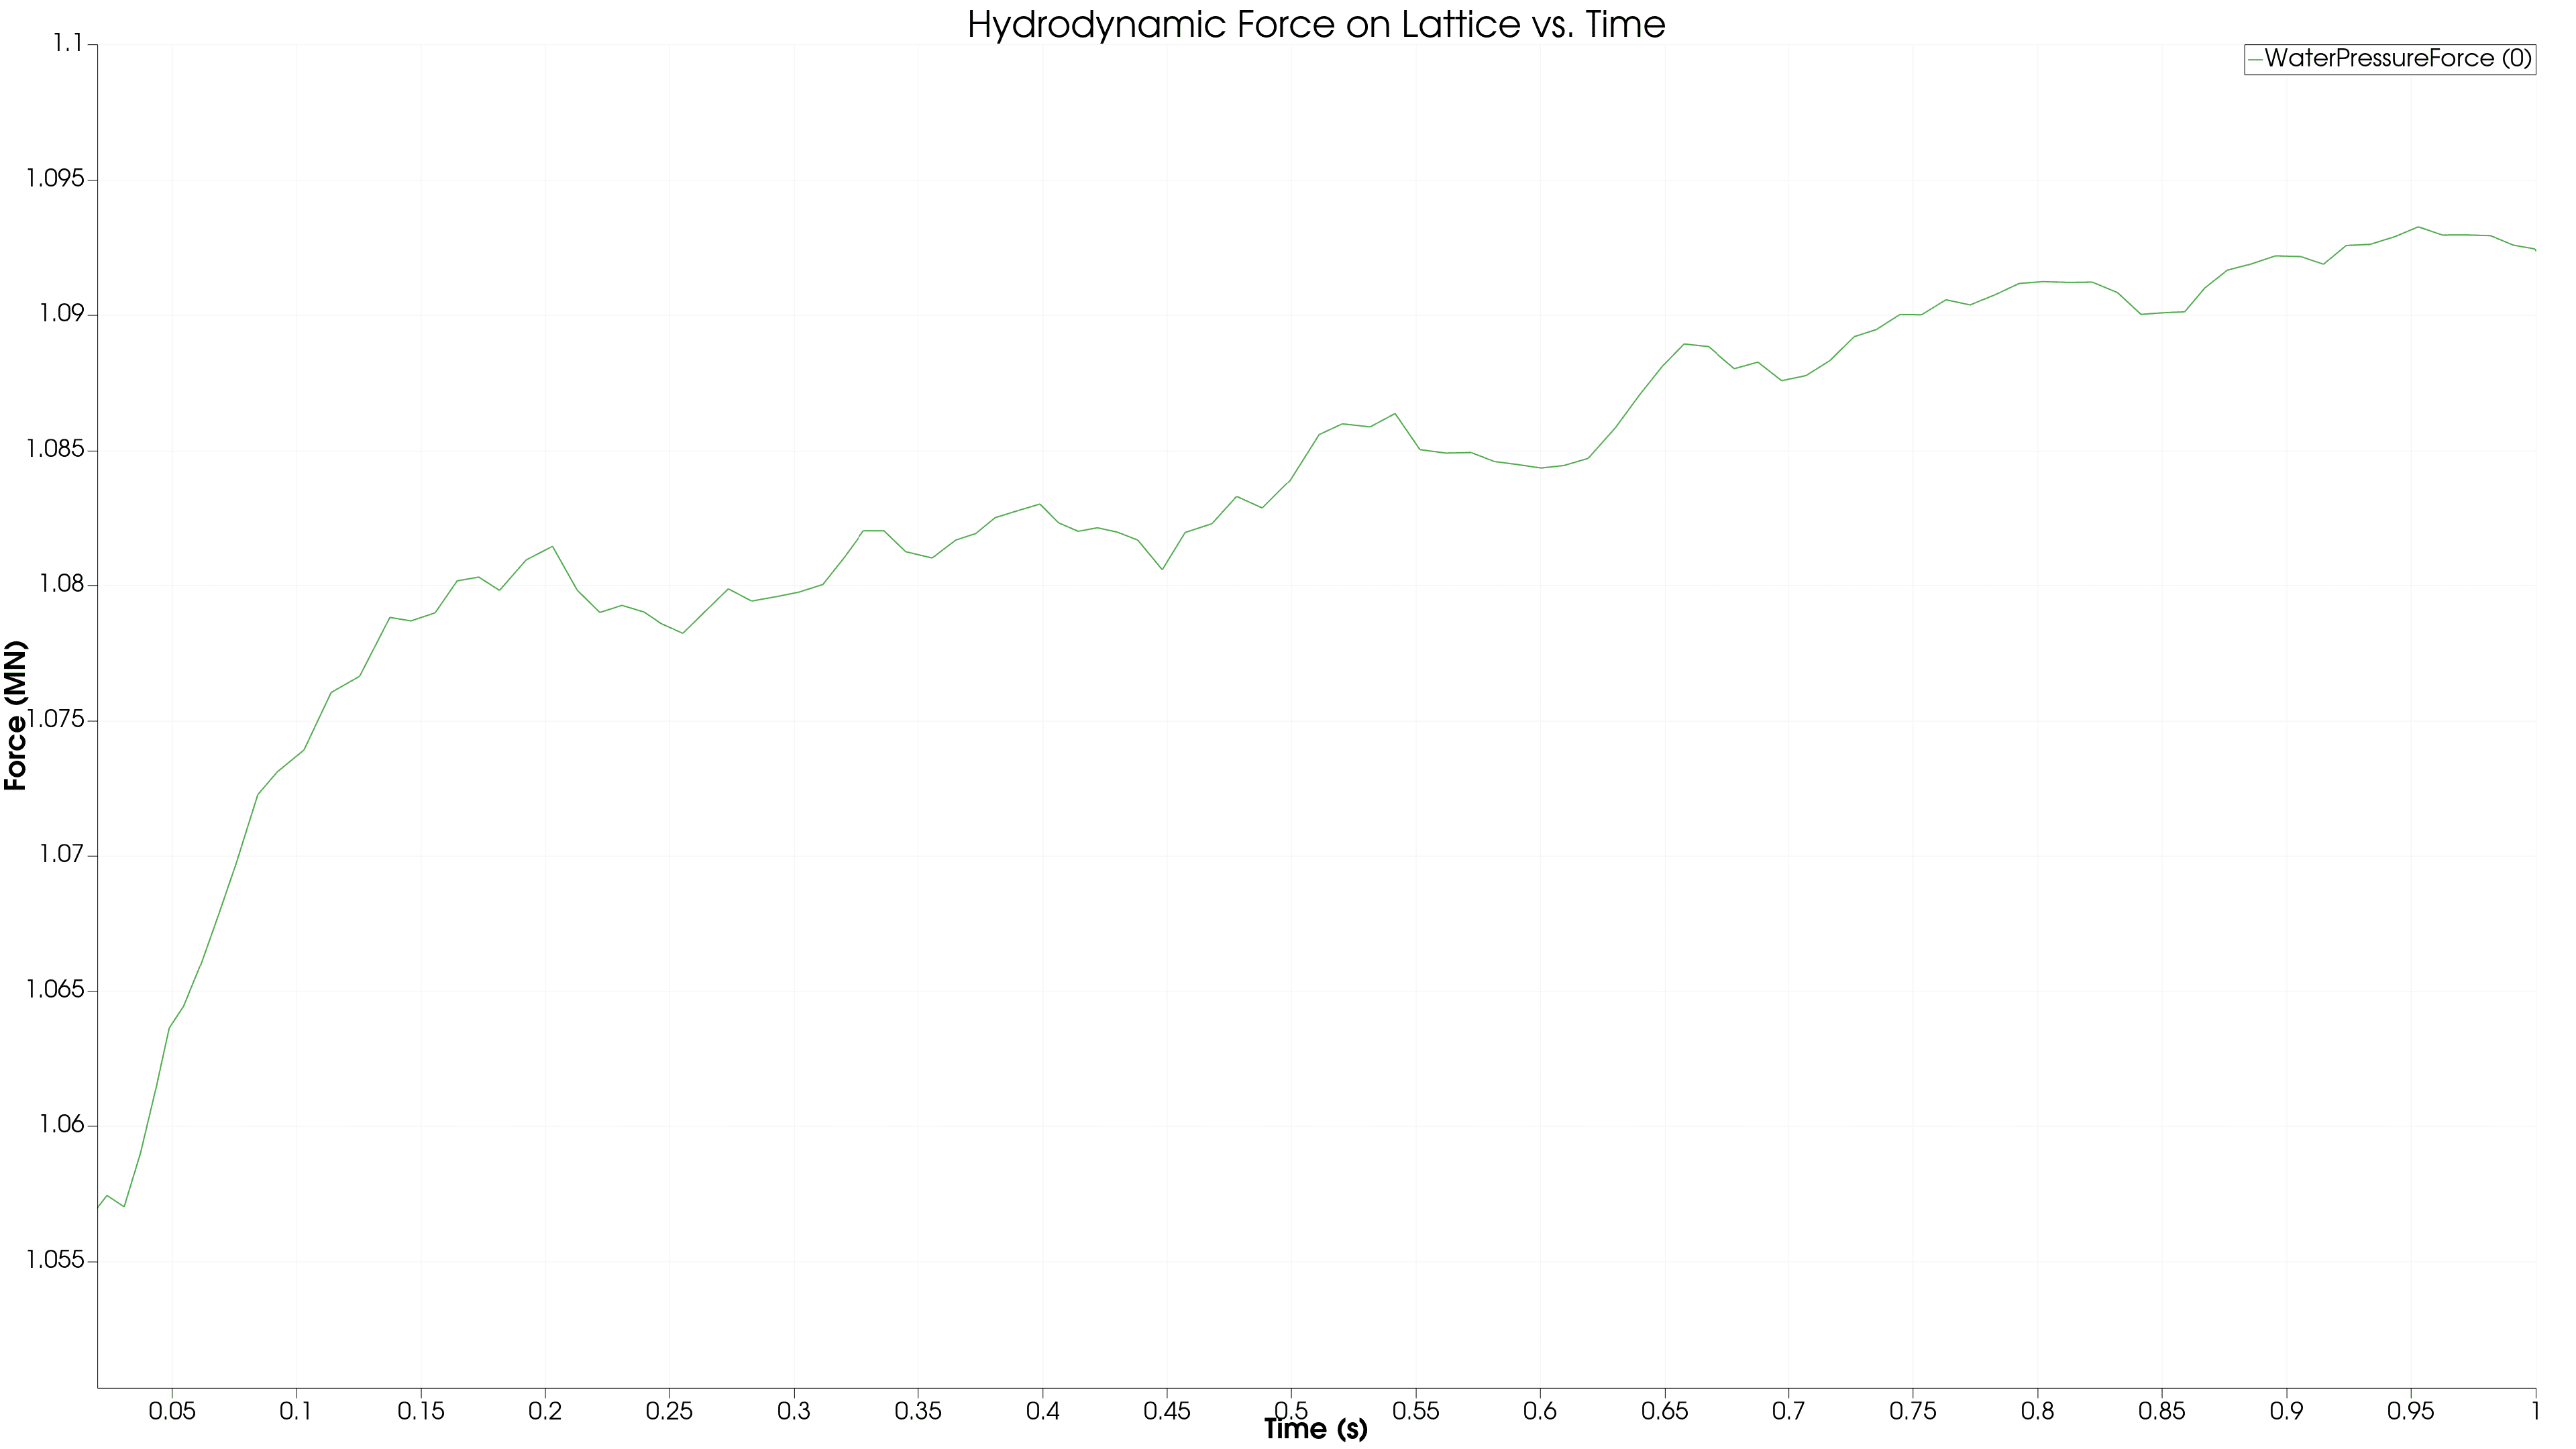
Water-only pressure force was independently integrated in ParaView using the pressure field, surface normals, and water volume fraction. The monopole reached a developed peak of approximately 1.005 MN, while the lattice reached approximately 1.093 MN during the simulated interval.
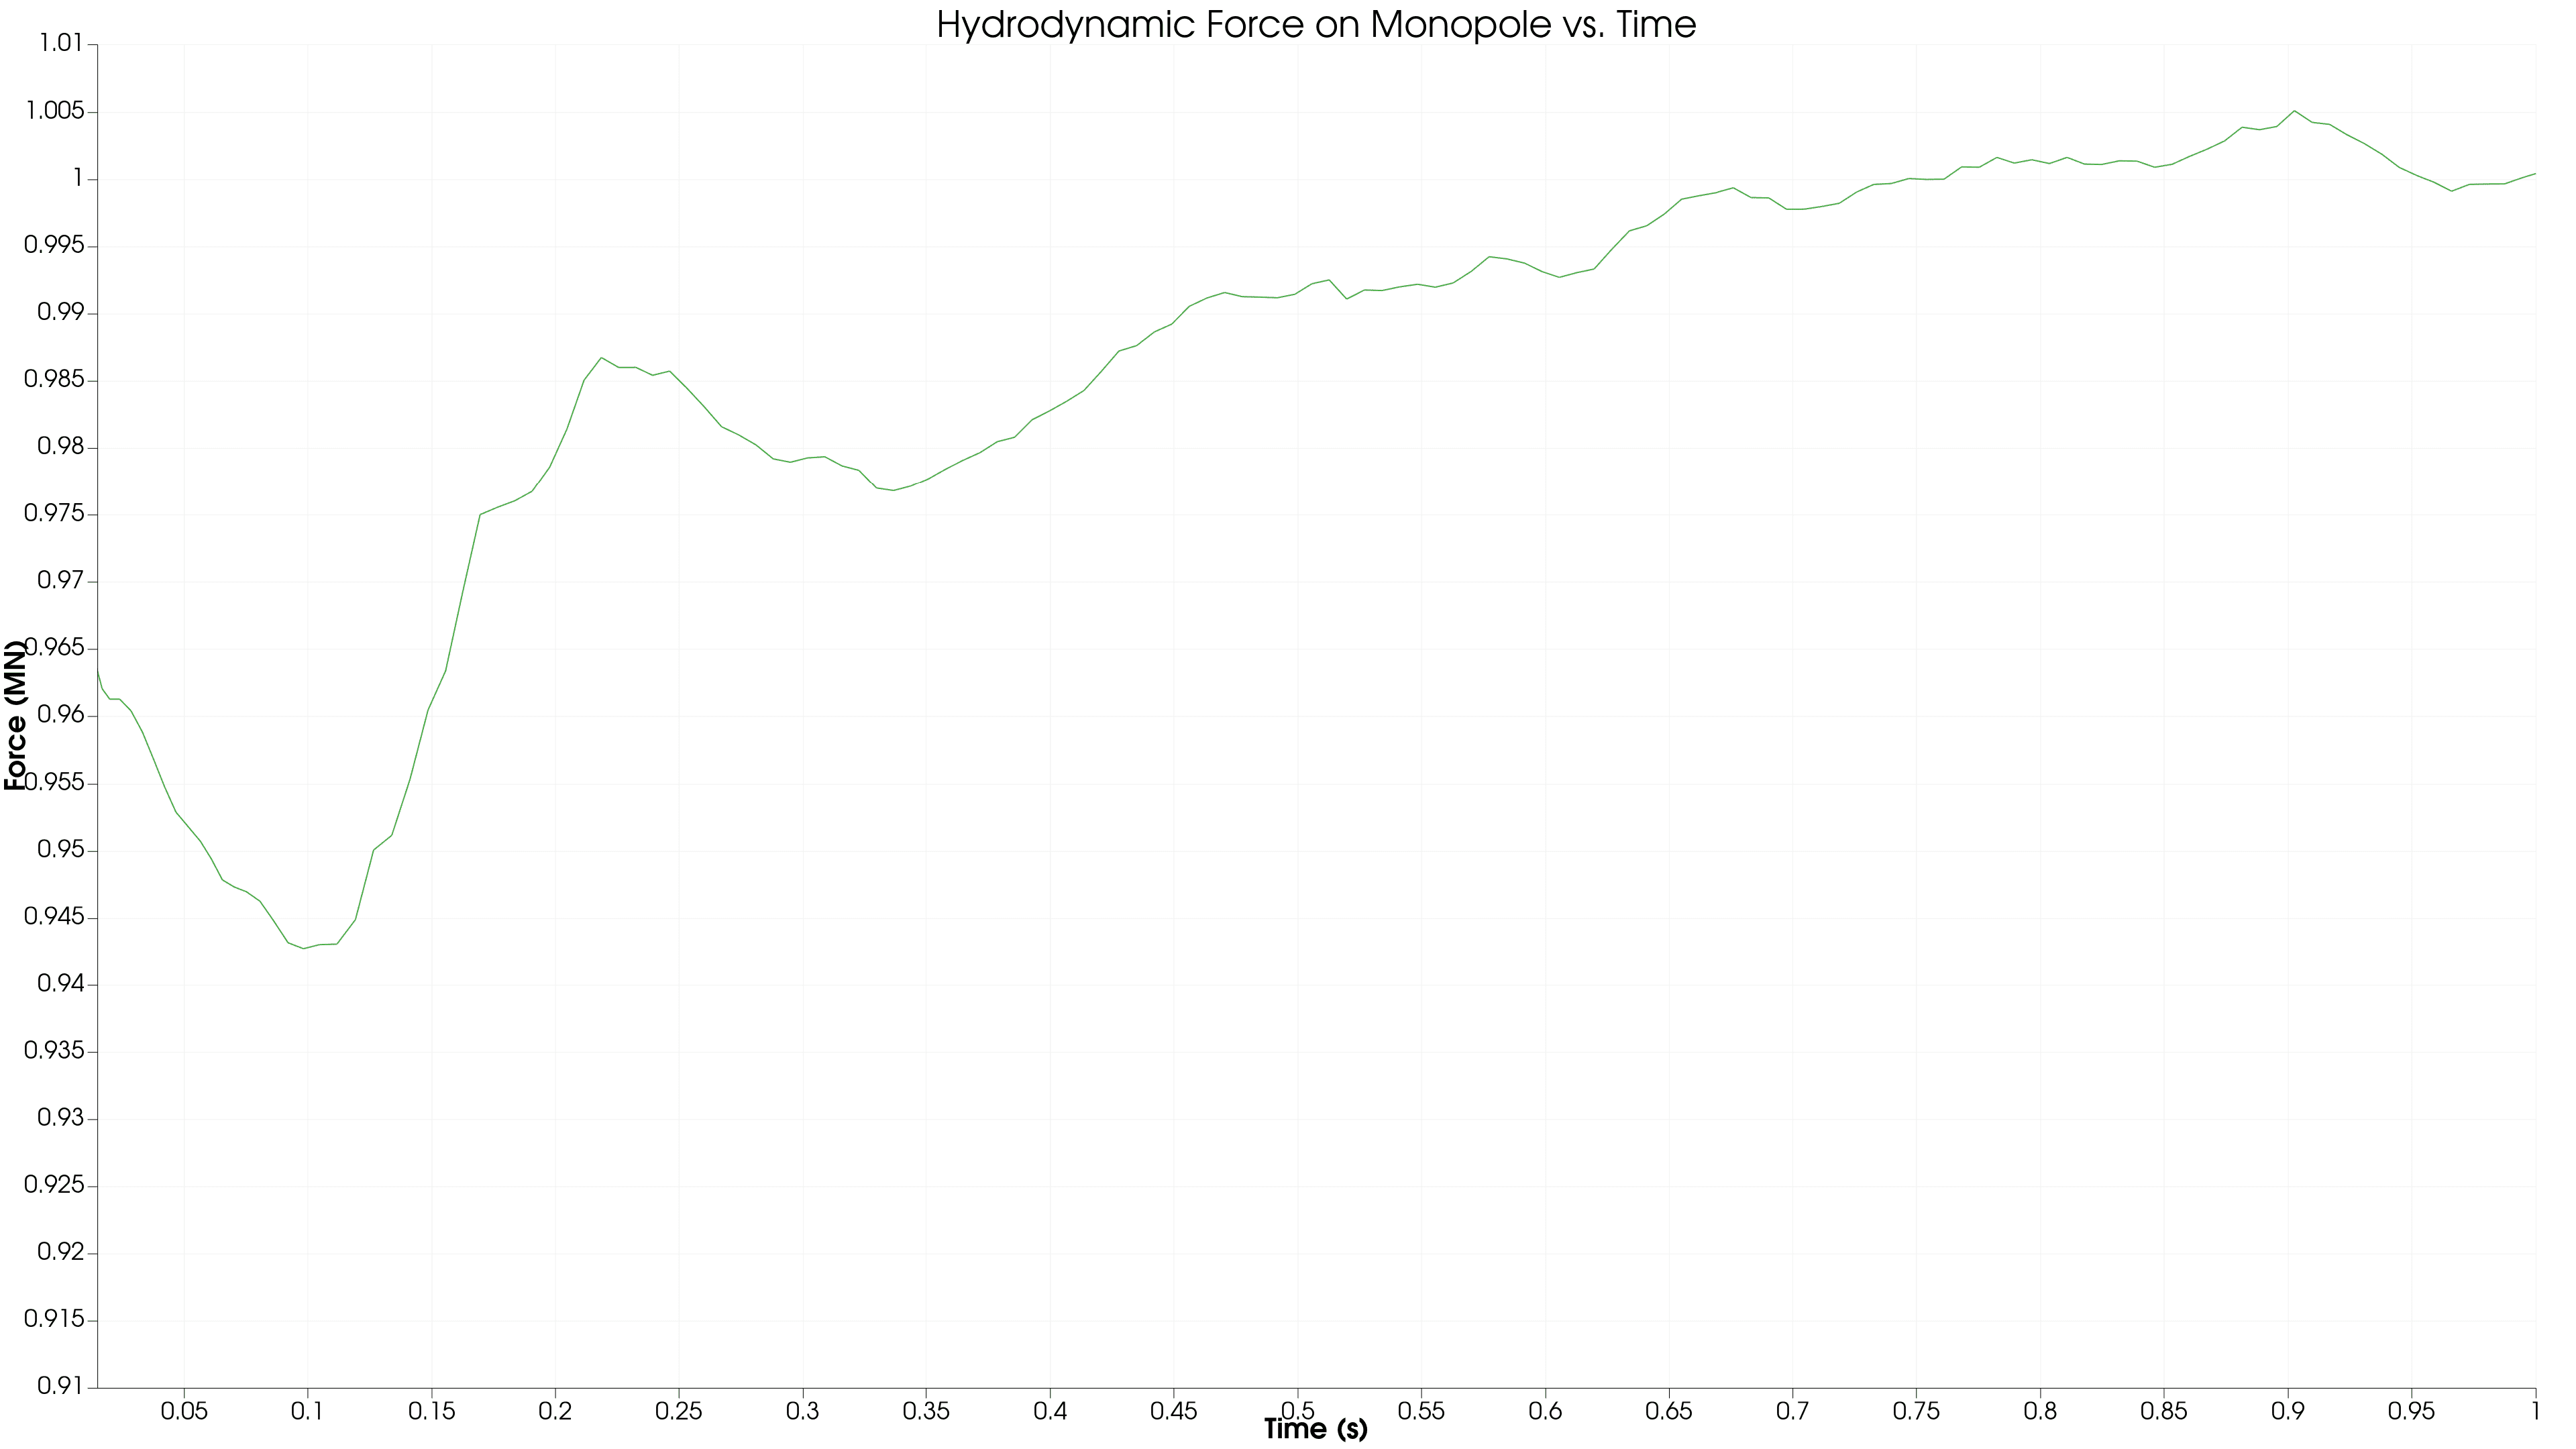
Monopole peak — ~1.005 MN
Lattice peak — ~1.093 MN
The lattice result remains slightly upward-trending near 1 s, so it should be interpreted as the peak reached within the simulated interval rather than a fully converged steady-state value.
Open geometry did not reduce peak hydrodynamic load.
Although the lattice allows water to pass through its frame, the integrated pressure load remained comparable to — and slightly higher than — the monopole under the simulated conditions. The result shows that reduced frontal solidity does not automatically translate to lower total hydrodynamic loading.